Debugging / Help
To help with debugging, and testing out Viewer API calls there are a few commands you can run in the console.
Viewer
Within a browser, right click the Viewer and chose inspect to get the console up. Here you can run interactive help commands and test out the API calls.
Help
To start the interactive help, run:
ida.Viewer.help();
This will print out the various help commands that you can run to see which API calls are available and how to call them.
It also has information on how to mock out Veeva data when running in the browser, allowing you to test specific Veeva functionality before publishing into Veeva Vault.
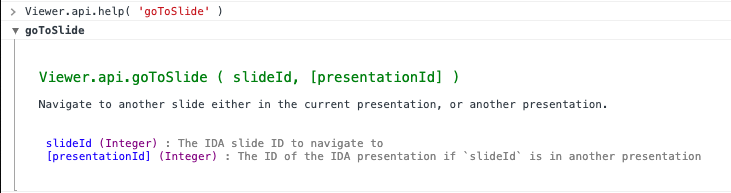
Interactive Help
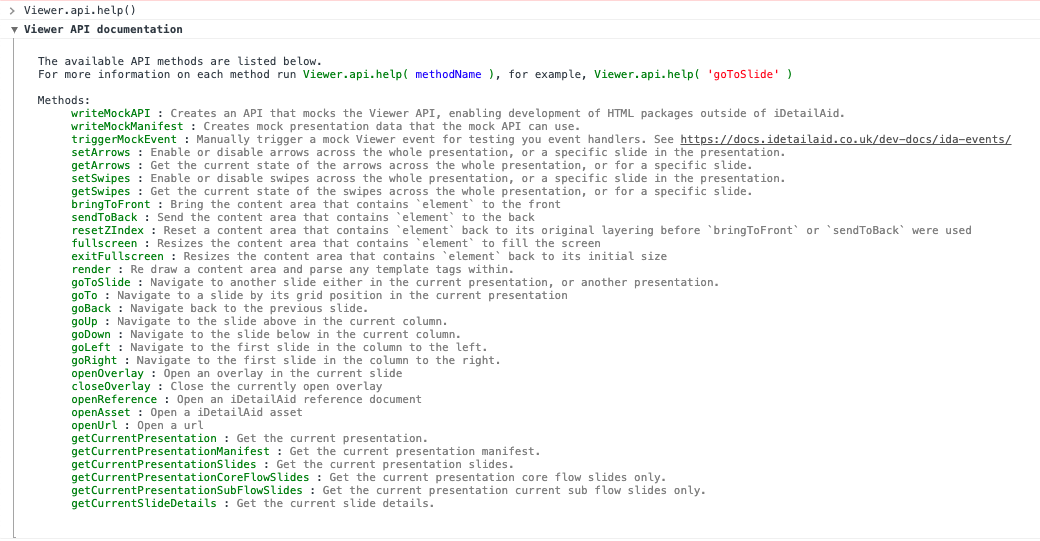
Interactive API docs
Logging
Extra console logging can be enabled to aid with debugging.
ida.Viewer.debug();
This will enable logging for ALL the log groups within the Viewer.
This is often too verbose. You can filter the logs to specific modules within the Viewer.
For example
ida.Viewer.debug('Events,Presentation');
The available log groups are:
| Log Group Name | Description |
|---|---|
| API | Logs for the core Viewer API |
| Actions | Logs for user initiated actions, such as opening and overlay, going to a slide |
| ApprovedEmail | Logs for Veeva Approved Email |
| Arrows | Logs for automatic navigation arrows |
| CLMPresentation | Logs for Veeva API calls around CLM Presentations |
| Clickstream | Logs for Veeva Call Clickstream |
| Detailer | Core debug logs |
| Events | Logs for Events that occur within the Viewer |
| Media | Logs for Images, Videos and other media |
| Presentation | Logs around the presentation |
| Session | Session logs |
| Templating | Logs for templating and interpolation |
| Tracking | Logs for Tracking |
| Veeva | General Veeva logs |
| iFrame | Logs for iFrame content |
Disable logging
To turn off the extra logging, simple pass false to the debug call.
ida.Viewer.debug(false);
Info window
You can also launch a debug window that shows you information such as titles, ids, modified dates etc.
Simply long press on a slide for more than 10 seconds to launch the info window.
iRep / Mobile CRM.
Once on iRep, you cannot view the console, but you can launch the info window as per above. As well as the iDetailAid information, you will also see Veeva Vault / Salesforce information about the current presentation and slide.
Simply long press on a slide for more than 10 seconds to launch the info window.